
Gráficas en VBA
El uso de gráficos dinámicos ayudan más que las tablas dinámicas en la comprensión y análisis de datos, como tasas, incrementos porcentuales, sucesos ocurridos en cierto tiempo o lugar, etc. No debería extrañarnos que en la vida laboral se tenga que hacer uso de muchos de estos gráficas, además estas tal vez deban contar con un formato establecido por las empresas y contar solo con cierta parte de la información de toda la base de datos. En estos casos lo recomendable es la creación de un programa en macros que permita la creación de estos gráficos teniendo como base solo las tablas dinámicas. A continuación se presentará un ejemplo:
1) Se tiene la base de datos:

(Para mayor visualización de la imagen, hacer click en la misma)
2) Se genera la tabla dinámica:

(Para mayor visualización de la imagen, hacer click en la misma)
3) A continuación se realiza en código en VBA:
Sub grafico()
Dim aTitulo As String
'Se oculta el procedimiento
Application.ScreenUpdating = False
aTitulo = "Ventas totales"
'ActiveWindow.DisplayGridlines = False
'Worksheets("Hoja2").ChartObjects.Delete
Sheets("Hoja2").Select
celda_inicial = Worksheets("Hoja3").Cells(3, 2).Address
area_de_datos = Range(celda_inicial).CurrentRegion.SpecialCells(xlVisible).Address
Charts.Add
ActiveChart.ChartType = xlColumnClustered
ActiveChart.SetSourceData Source:=Sheets("Hoja3").Range(area_de_datos)
ActiveChart.Location Where:=xlLocationAsObject, Name:="Hoja2"
With ActiveChart
.HasTitle = True
.ChartTitle.Characters.Text = _
"Ventas de cada vendedor"
.Axes(xlCategory, xlPrimary).HasTitle = True
.Axes(xlCategory, xlPrimary).AxisTitle.Characters.Text = aTitulo
.Axes(xlValue, xlPrimary).HasTitle = True
.Axes(xlValue, xlPrimary).AxisTitle.Characters.Text = "Nuevos soles"
End With
ActiveChart.HasLegend = False
ActiveChart.HasDataTable = True
ActiveChart.DataTable.ShowLegendKey = True
ActiveChart.HasPivotFields = False
Selection.AutoScaleFont = True
With Selection.Font
.Name = "Arial"
.Size = 8
.Strikethrough = False
.Superscript = False
.Subscript = False
.OutlineFont = False
.Shadow = False
.Underline = xlUnderlineStyleNone
.ColorIndex = xlAutomatic
.Background = xlAutomatic
End With
Selection.AutoScaleFont = True
With Selection.Font
.Name = "Arial"
.Size = 6
.Strikethrough = False
.Superscript = False
.Subscript = False
.OutlineFont = False
.Shadow = False
.Underline = xlUnderlineStyleNone
.ColorIndex = xlAutomatic
.Background = xlAutomatic
End With
With Selection.Border
.Weight = 2
.LineStyle = -1
End With
Selection.Interior.ColorIndex = xlNone
ActiveChart.PlotArea.Select
With Selection.Border
.ColorIndex = 16
.Weight = xlThin
.LineStyle = xlContinuous
End With
Selection.Interior.ColorIndex = xlNone
ActiveChart.ChartArea.Select
ActiveChart.ChartTitle.Select
Selection.AutoScaleFont = True
With Selection.Font
.Name = "Arial"
.Size = 8
.Strikethrough = False
.Superscript = False
.Subscript = False
.OutlineFont = False
.Shadow = False
.Underline = xlUnderlineStyleNone
.ColorIndex = xlAutomatic
.Background = xlAutomatic
End With
Selection.Font.Bold = True
ActiveChart.Axes(xlValue).AxisTitle.Select
Selection.AutoScaleFont = True
With Selection.Font
.Name = "Arial"
.Size = 8
.Strikethrough = False
.Superscript = False
.Subscript = False
.OutlineFont = False
.Shadow = False
.Underline = xlUnderlineStyleNone
.ColorIndex = xlAutomatic
.Background = xlAutomatic
End With
Selection.Font.Bold = True
ActiveChart.Axes(xlCategory).AxisTitle.Select
Selection.AutoScaleFont = True
With Selection.Font
.Name = "Arial"
.Size = 8
.Strikethrough = False
.Superscript = False
.Subscript = False
.OutlineFont = False
.Shadow = False
.Underline = xlUnderlineStyleNone
.ColorIndex = xlAutomatic
.Background = xlAutomatic
End With
Selection.Font.Bold = True
Application.ScreenUpdating = True
Application.CommandBars("Chart").Visible = False
End Sub
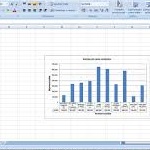
4) Finalmente se obtiene la gráfica siguiente:

(Para mayor visualización de la imagen, hacer click en la misma)
Elaborado por: Kendy Mamani Aliaga.